Desmos 3D is a graphing tool used mainly for graphing equations, functions, vectors, and other mainly mathematical things. There are a number of ways to graph the same thing using different shortcuts. For Digital Arts and Humanities specifically, it is a really fast way to make a simple 3D model of something, such as a sphere or an ice cream cone or such (or something more related to humanities with the same shape).
If you wanted to model something like an ice cream cone, you could use knowledge of multivariable calculus (if you have some).
- Start with a simple function that roughly looks like a cone:

But wait, there are two parts: one upright and one inverted. We need to make a parameter to only have the top portion. We can just use the squiggly brackets for this:

Now we have a regular cone. We may want to make it thinner so it’s more ice cream cone-looking. With this, we can multiply the right by a constant:

This gets us a better shaped cone. Next, lets add the ice cream, or the sphere.

This is a lot in one step, but first I used the built-in sphere function to make a rough sphere, where the center is at point (x,y,z) and the radius is the second parameter. My radius is based on the radius of the cone at the height where they both meet each other, which is sqrt(5/2) (or sqrt(z/2)) in this case. I also added a max height for the cone so that it did not continue past the meeting point of z = 5. I then set the bounds of the graph larger (by zooming out) so that the full sphere was in view.
Finally, let’s add some realistic color:
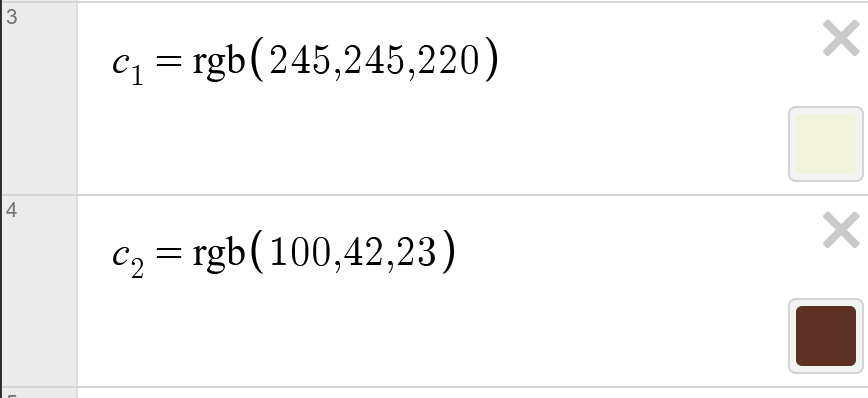
We need to make color functions to add custom colors to Desmos. For chocolate ice cream, these are the RGB values for beige and brown.

We then set the colors to the cone and sphere using the settings button above the functions and there we go! An ice cream cone.
This user guide was helpful, such as making the sphere function:
I think this tutorial is really clear, especially the way you break the workflow into steps from CSV to a finished PNG map. The explanation of converting the spreadsheet into an sf object was helpful because it shows how simple tabular data can become spatial data with just a few lines of code. I also liked that you included the export step at the end, since that makes it easy for someone to actually use the map in a blog post or project.
I think your tutorial does a nice job breaking down the modeling process step by step, especially how you used constraints and parameters to shape the cone and sphere. The explanation of how the radius connects to the point where the cone and sphere meet helped make the math behind the model easier to follow. I also liked that you included the color functions at the end, since it shows how even a simple mathematical model can be adjusted visually to resemble something more recognizable.
I really like the tutorial and the directions you have posed with every step. I enjoyed watching a full process come together and be able to use this for modeling. Desmos also has the potential to be a tool for modeling historical architecture with calculations. I also like the helpful links that you included. For someone new to desmos, your tutitoral along with the links can teach a lot.
I enjoyed reading your tutorial! When I was in middle school, I created a 2D electric guitar in desmos by using equations like you did. It was difficult but the final product was rewarding. I didn’t know that desmos offered 3D options, so this is definitely something I need to check out!
This is a very cool application of Desmos! I definitely have a fair amount of experience with the program over the years in several different math classes, but I had not really thought about it as a way to be creative and make objects or designs. I had only ever used it for purely academic or school purposes. This makes me appreciate Desmos a little more than I used to! Your tutorial is also very structured and easy to follow, especially for someone that has a basic understanding of some mathematical formulas.
Your post gives a clear example of how Desmos can be used for more than just math graphing. I like how you walk through the process of building the ice cream cone step by step, starting with the cone equation and then modifying it using parameters and constants to get a more realistic shape. That progression makes it easier to understand how functions translate into 3D models. The explanation of adding the sphere for the ice cream and adjusting the graph bounds was also helpful